
Geoff heads up monetization and growth at FlipaClip, a powerful and fun tool that makes frame-by-frame animation easy. His career started in digital advertising sales at AOL and Amazon, moving into the mobile marketing space in 2012. Geoff has since staked his claim in the publisher business, leading monetization and growth strategies at FlipaClip since 2019.
Learn more about Mobile Hero Geoff.
The mobile landscape has become increasingly competitive for publishers and ad tech companies. We face many challenges, including direct competition, consolidation, regulation, and more. As a result, it's critical to understand who your users are and how you can better meet their needs.
At FlipaClip, we have a dynamic, global audience of creators of all ages. To keep them engaged, we've built our app with as many remote configurable features and functionalities as possible. This technology allows us to adjust real-time user experience, revenue, and growth strategies for different audience segments.
However, to properly apply remote configurable features and functionalities (and identify more features to include server-side), you need to segment your audiences at the user level.
Why Audience Segmenting Matters
There's an age-old saying, "If it ain't broke, why fix it?" Or, if there is no perceived problem, why bother with extra analysis and testing?
For us, the reason is clear. Users demand better quality from the apps and games they use year after year. Segmenting your user base into different audiences can allow you to identify and test opportunities for improving core KPIs and revenue.
Top reasons why you should segment your users include:
- Psychology / Purchasing Power: The average user differs across geos, age groups, device types, and more. If you're using a one size fits all approach, there will likely be a lot of room for improvement across all core KPIs.
- Time: Present-day conditions will likely differ from three to five years ago. The maturity, psychology, and purchasing power of a 27-year-old will differ from when they first installed the app four years earlier.
- Live Ops: Purchase, churn and event-driven KPIs differ based on lifecycle—the first 0-10 minutes for a new user is very different from their first 60-120 minutes in your app, and so forth.
Breaking your audiences into segments can help answer many questions and identify new paths for revenue and user growth.
Reporting
Minor tweaks can create a big impact across different audiences. In many cases, there is low-hanging fruit everywhere for improving user experience, MAUs and revenue.
In most cases, we can spot opportunities in core KPIs (ARPDAU, LTV, retention) ahead of time by analyzing key event-driven KPIs which improve engagement. Conversely, we can spot a fatal flaw in a monetization feature rollout that may check all initial boxes. There might be something deadly under the hood that’s impacting a small segment of critical users.
Three questions we ask when evaluating or testing an opportunity are whether or not there are impacts on:
- Core event-driven KPIs
- Conversion rates, ARPDAU, ARPMAU, LTV
- Engagement, DAU, and, MAU
We apply these three fundamentals for our standard audience segments: age groups (COPPA, 13-17, 18+, etc.), geos (tier 1 vs. tier 2/3/4), and device type. If needed, break down these segments further (i.e., 10-minute increments up to two hours from install on D0, or Day 0 vs. < Day 3, etc.).
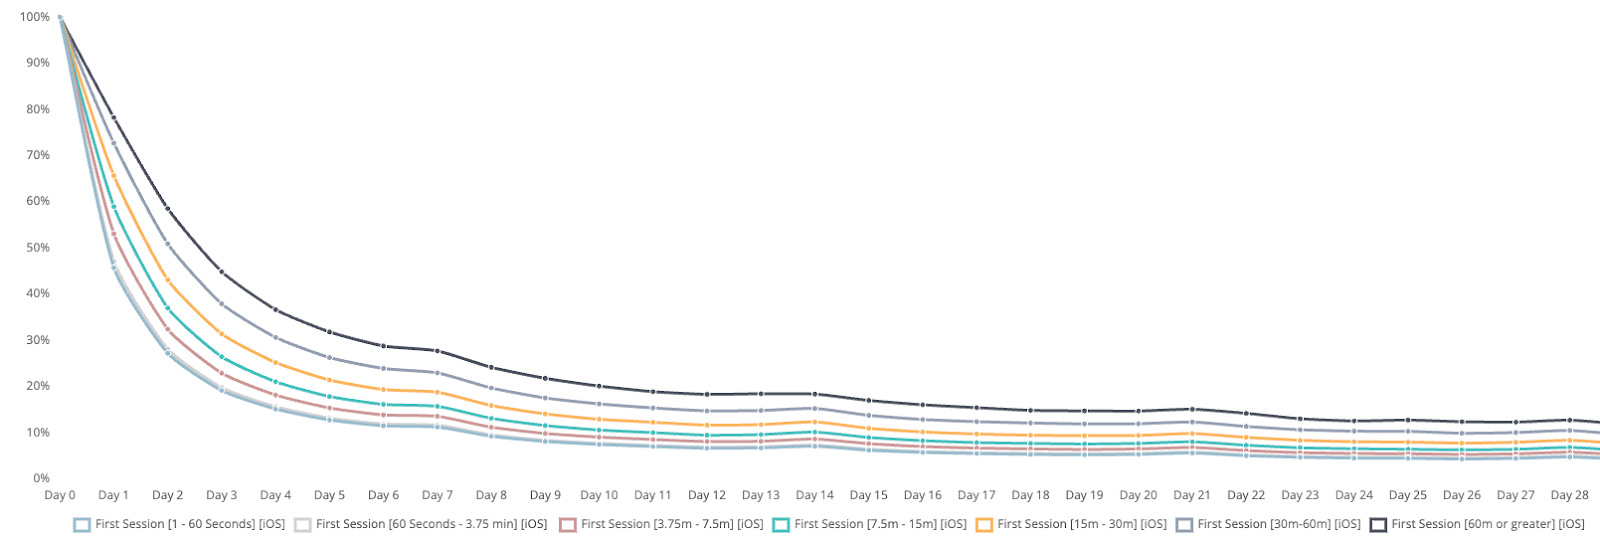
Standard retention curve broken down by time (spent in-app) buckets for users’ first session
We look at data in two different ways: absolute and relative reports. An absolute report maps user behavior over a specific period—a relative report charts cohort users from their initial install date.
Relative reporting is a powerful way of analyzing the lineage of a user's daily behavior from installation, allowing you to refine their experience in greater detail.
Use Cases and Scenarios
There are many use cases where audience segmenting can and should be applied across revenue initiatives (ads, IAP, subscriptions), features and product releases, and engagement strategies.
Here are just a few:
Adjusting ad logic and frequency - Different audience groups can and should have different ad strategies based on age, geo, payers vs. non-payers, and device type.
Example Scenario: Increasing daily interstitial ad caps for all users.

Geo’s - Tier 2 Control vs. Daily Cap increase: ARPDAU (y-axis) vs. days since install (x-axis)
Releasing a new monetization product - How does this feature impact your core audiences? You might see short-term gains in ARPDAU and LTV at a high level, but does it hurt your long-term growth and revenue potential elsewhere?
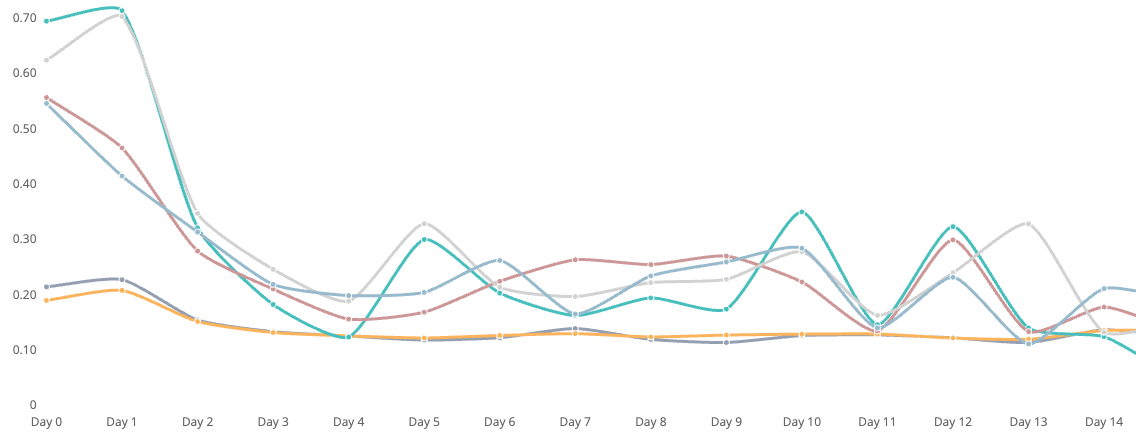
Example Scenario: Opening up a premium feature to all freemium users previously hidden behind the IAP/Subs paywall instead of rewarded video.
Age Groups: Premium conversion rate (y-axis) vs. days since install (x-axis)
Engagement - Which audiences do the tweaks to your onboarding flow impact the most?
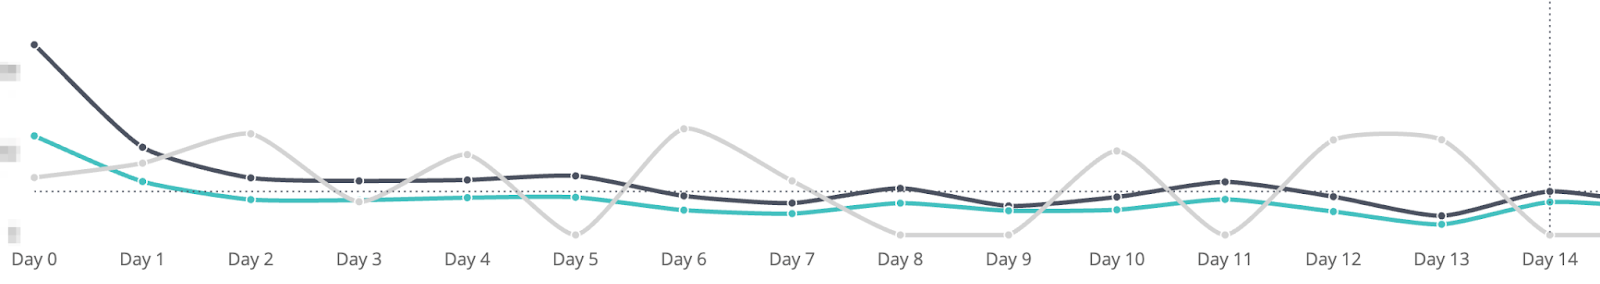
Example Scenario: New contest release and associated CRM engagement.
Contest Performance: Engagement rate lift (y-axis) vs. days since install (x-axis)
Technical Requirements
Audience segmenting requires the technical infrastructure to map every associated data point with its respective IDFV, IDFA, GAID, and or individual user accounts, including:
- All analytical events, parameters, and associated values
- Ads, IAP, and subscription revenue
- Attribution and cost reporting for UA
A handful of third-party vendors specialize in analytics, cost reporting, BI, and revenue, but only a few can tie it all together. As a result, it is common for larger publishers to build out their own systems for processing user-level data. However, this requires a substantial investment in engineering and a data science team that most small to mid-market apps do not have.
Tying in all revenue streams, events, and parameter combinations is complex. That said, the gains are worth it whether you go in-house or outsource to a third party.
Tying It All Together
Given the ever-changing nature of our industry and the complexities of testing and releasing new products and services, it is not enough to rely on standard metrics. It is important to consider the user journey because small changes can have a big impact that may not be reflected in the core metrics.
By closely analyzing key event-driven KPIs, we can improve revenues, user experience, core event KPIs (per-user avg), and overall user growth.