If you’ve created an app or are responsible for marketing an app, you probably think a lot about how to evaluate the lifetime value of your users. However, before I dive into some of the ways to calculate LTV, there are a few things you should keep in mind.
Firstly, there are simplistic ways and comprehensive ways to calculate LTV. Typically, the more comprehensive you go, the more accurate you will be if your math and logic are good. More on that later.
Secondly, you need to define what exactly is the lifetime of your users. This is typically the point in a user’s lifecycle where future revenue expected from them, on average, is negligible. Maybe you have a game that makes 99.5% of its revenue within 90 days after install, so you use a Day 90 LTV.
Finally, consider that different sources of acquisition will bring in different types of users. A highly targeted Facebook ad campaign may have a much higher LTV than a run-of-network display campaign. Parse your data. Split by country, operating system, acquisition source, gender, age group, etc. Whatever the most specific grouping you can use to get a statistically significant cohort of users for is ideal.
Learn more about Matthew from his Mobile Heroes profile.
Calculating LTV
Now for the fun stuff. Grab that cohort of users and look at how much revenue they’ve generated. For a group of 1,000 users acquired 80-100 days ago who generated $800 in revenue, we can conclude that each user has an $0.80 average revenue per user (ARPU) at roughly day 90. Calculation: Cohorted D90 revenue / cohort size = D90 ARPU. This number alone tells us very little, but it is a good start.
Note in the graphs below two LTV curves that both have the day 90 LTV equal to $0.80. The graph on the left appears to continue going up, while the right graph seems to be leveling off. Churn rate, re-engagement rate, and when users monetize all affect these curves.
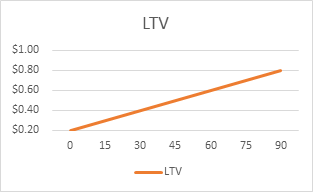 |
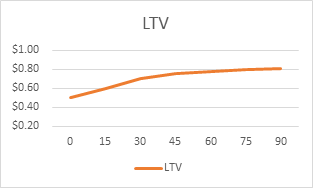 |
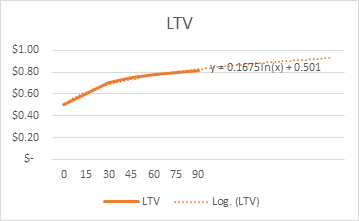
Spend time getting intimate with your data. If you can, calculate the ARPU (average revenue per user) for a cohort of users on their day 0, 15, 30, 45, and 60. Plot these numbers and see if you are leveling off or continuing to rise. Add a trend line to the graph that fits the curve (usually a power curve or log curve) and get the trendline formula. Use the equation to project out to future dates.
If you want to dive even deeper into LTV calculations, download this awesome (and free) calculator my co-workers at Tilting Point put together. And if you want to get super fancy, enlist machine learning / A.I. to do heavy analysis of your data and build out your projections that will blow the competition away.
Matthew Sadofsky is one of Liftoff’s first ever featured Mobile Heroes. At that time, he worked in the dating apps world, running UA for AYI. He’s since moved on to working as Senior Manager, Growth Marketing at Tilting Point, a games partner for top independent development studios. Tilting Point empowers elite developers with expert resources, operational support, and funding to give carefully selected games mainstream success. They are based in Manhattan and built by industry leaders from EA, Gameloft, Kabam, Zynga, and more.